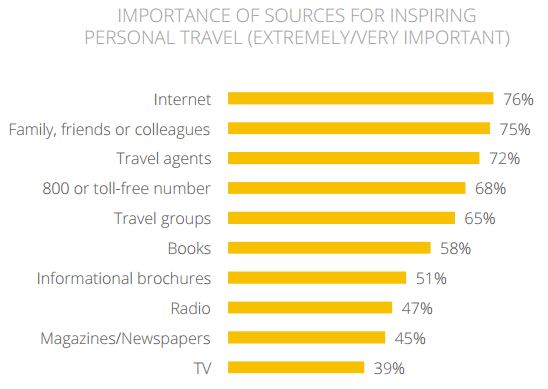
As technology fuels a global interconnectedness throughout society, it’s no surprise that the internet and word of mouth are considered the most important sources of information today. This is particularly true in the travel industry, where people are either planning imminent travel or just seeking inspiration for their next journey.
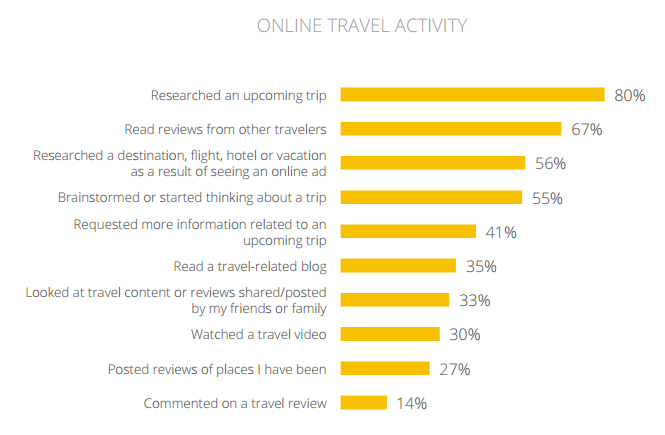
In fact, 82.5% of respondents in a study said they “always” use the internet for planning a trip, and nearly all (97.7%) respondents read other travelers’ online reviews. Another study by Google asked affluent participants about their online travel activities, of which the top two were researching an upcoming trip (80%) and reading reviews from other travelers (67%).
Online Travel Agencies (OTAs) in the Bazaarvoice network see 22% of review pageviews occur on a mobile device!
Online Travel Agencies (OTAs) in the Bazaarvoice network see 22% of review pageviews occur on a mobile device!
As both a travel enthusiast and a member of our Analytics team, I was curious to dig into the Bazaarvoice network data to better understand this online research behavior. So, we analyzed a sample of 300,000 hotel reviews that were submitted on several major Online Travel Agency (OTA) sites from both North America and the United Kingdom. Check out what we found.
Travelers love the same things, but hate different things
As much as I’d love to read hundreds of thousands of reviews one-by-one, text analysis is the more efficient method for understanding “what” is actually being discussed in a large set of text data. So, we segmented the hotel reviews by the type of traveler that wrote them, and then ran each through a sentiment engine.
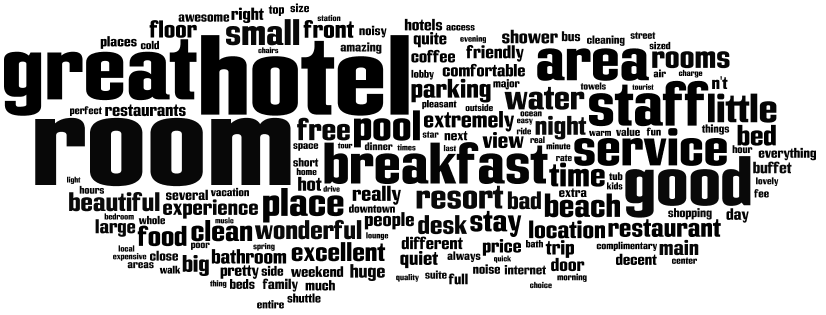
We found that the positive themes are similar across all traveler types, but the negative themes have much more variability. In other words, everybody enjoys the same things about hotels, but have differences in what they are sensitive to. For example, the top negative themes for business travelers are “internet service” and “fitness room,” but for leisure travelers are “water temperature/pressure” and “small room.” The top positive themes for all groups were “location,” “front desk,” “staff,” and – you guessed it – “breakfast.” Who doesn’t like breakfast?
Download The Conversation Index Vol. 7 here to see how other shopping seasons like back-to-school, the summer travel season, and Boxing Day affect consumers’ review habits.
We also looked at travelers who were either with their families, or with friends. Again, the positive themes were consistent across the board, but there were strong variations in the negative themes. Families (perhaps with young children) are concerned about things like smoke, noise, and pool size, whereas groups of friends are put off by poor A/C and the quality of the pull-out sofa bed.
The final traveler types we investigated were people who travelled solo, or with a significant other. It turns out that the couples trying to have a quiet, romantic evening are upset with “loud noise”, while singles mainly want a good “shower” and decent “A/C”.
Leisure and family travel skew highly seasonal
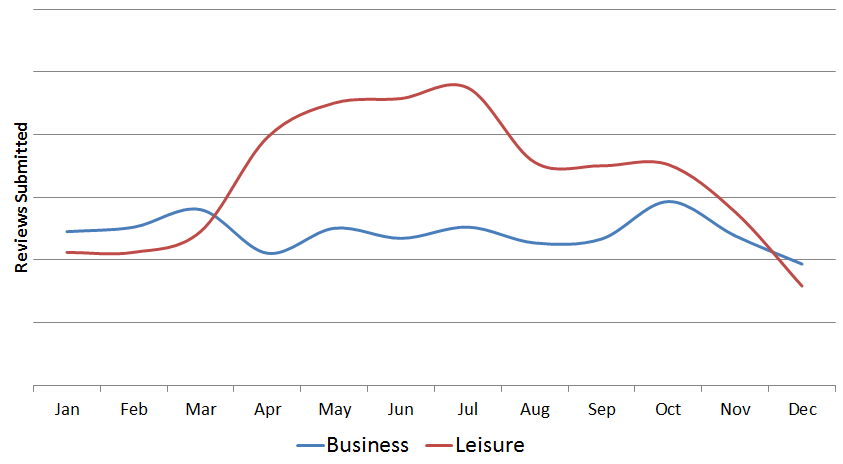
Marketers and hoteliers already know that travel is a seasonal industry. Even though travelers are looking for inspiration or doing research several months in advance of their trip, we noticed some striking trends. Review submissions on OTAs increase by 48% from January to July, highlighting the increase in travel during the summer months.
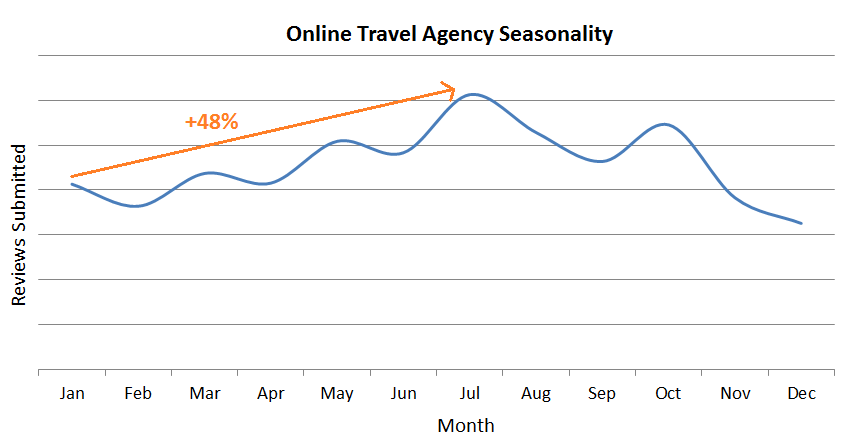
Dissecting this graph by traveler type helps us to visualize and validate some of our assumptions. For instance, business travel is fairly consistent year round, but leisure travel booms in late spring and mid-summer when there is more time for vacation.
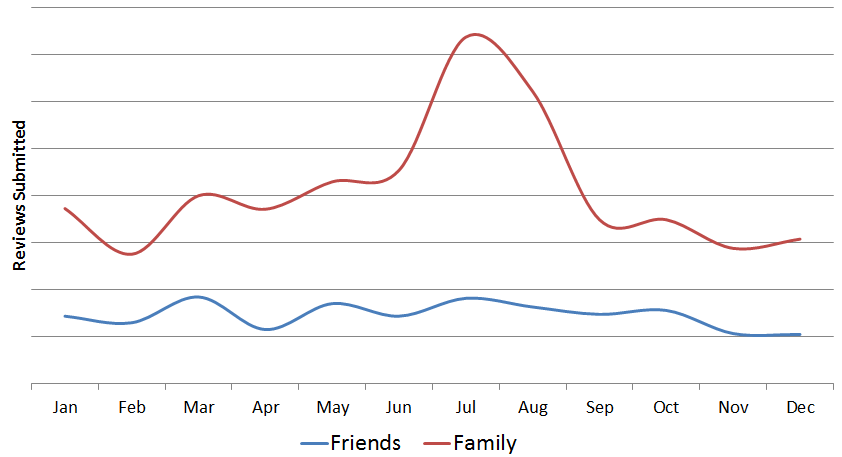
Similarly, people seem to travel with their friends year round, but family travels together more often – but especially in July when the kids are off school.
Your best members are your toughest critics
I’ve said it before, and I’ll say it again: Capturing contextual data is essential to understanding your customers.
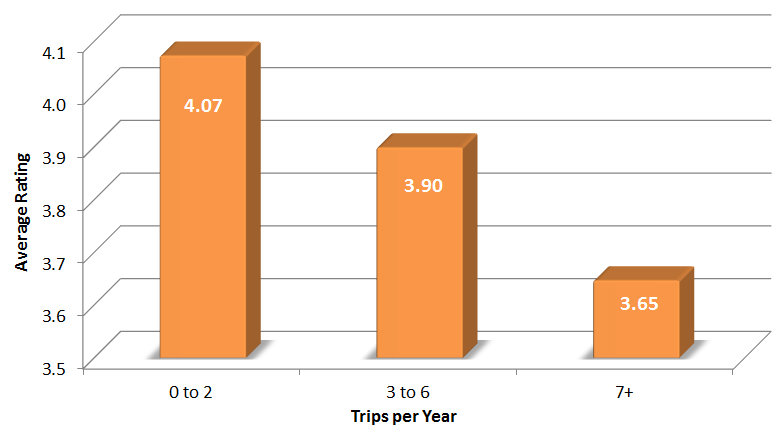
Travelers that take seven or more trips per year are experts. This group has been around the block (or globe) a few times, and is most critical of their hotel experience because of it. Seventy-seven percent of affluent travelers belong to a hotel loyalty program. As such, they’ve traveled thousands of miles and have stayed in your hotel hundreds of times to earn their status. Are your rewards worth it?
Travel is far from the only highly seasonal industry. We recently analyzed over 35 billion product pageviews from our clients across the globe to explore how seasonal trends affect customer conversations. Download The Conversation Index Vol. 7 here to see how shopping seasons like back-to-school and the winter holidays affect consumer review usage.